Know exactly where your cash went — and where it is going next.
The BMO Cash Flow Management suite gives Malaysian SMEs a complete picture of company cash: an audit-ready Statement of Cash Flows (MFRS 107 / MPERS), a forward-looking 13-week Cash Flow Forecast, a daily Bank & Cash Book, and a one-click setup that maps even charts with thousands of accounts automatically.
What does BMO Cash Flow Management do?
It turns daily accounting entries into a clear cash story for business owners, finance teams, auditors and bankers.
BMO Cash Flow Management helps SMEs answer three key questions: where did our cash go, why is profit not the same as cash, and will there be enough cash in the coming weeks. It combines cash flow statement reporting, forward forecast, bank/cash book checking and one-time account mapping in BMO Accounting.
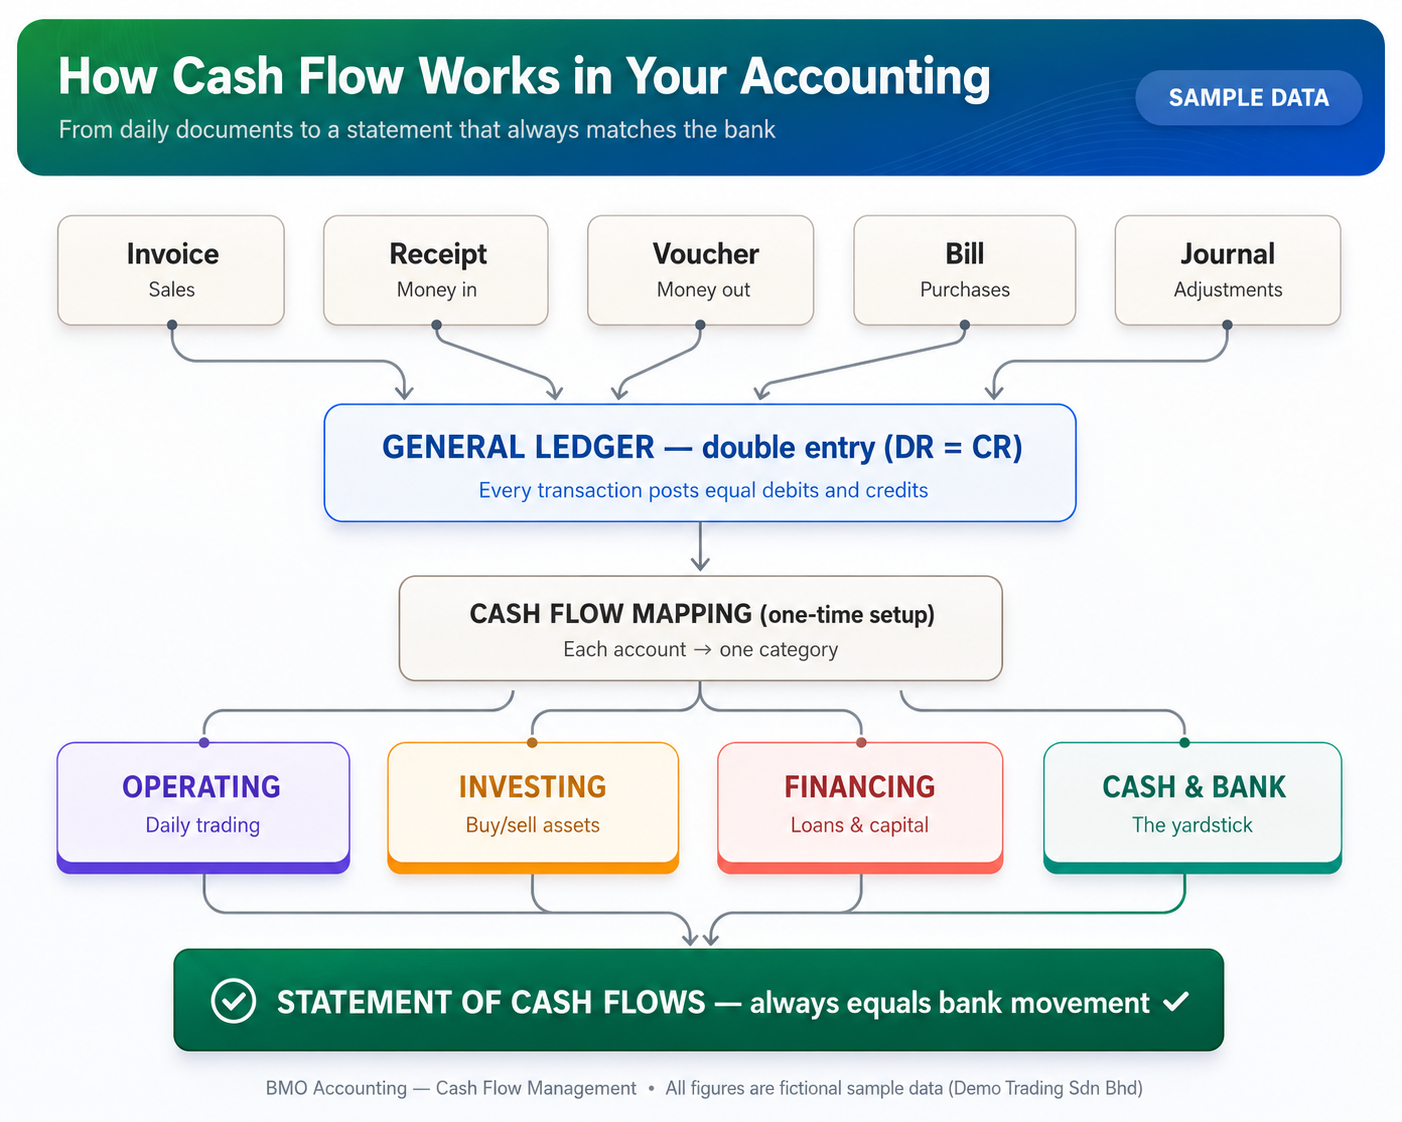
How cash flow works in your accounting
Every document your staff keys in — invoice, receipt, voucher, bill, journal — posts a balanced double entry to the general ledger. A one-time mapping tags each account as Operating, Investing, Financing or Cash. From there, the Statement of Cash Flows builds itself for any period, and because of double entry, it always agrees with your bank balances.
- Invoice, receipt, voucher, bill and journal entries post into the general ledger.
- Each account is mapped once to a cash flow category.
- Operating, investing, financing and cash movements feed the Statement of Cash Flows.
- The statement equals bank movement, every time.
Why profit is not cash: a company can make RM 50k profit but only RM 22k lands in the bank — because customers have not paid, money sits on the shelf as stock, and cash went to equipment and loan instalments. The Statement of Cash Flows reconciles the two, line by line.
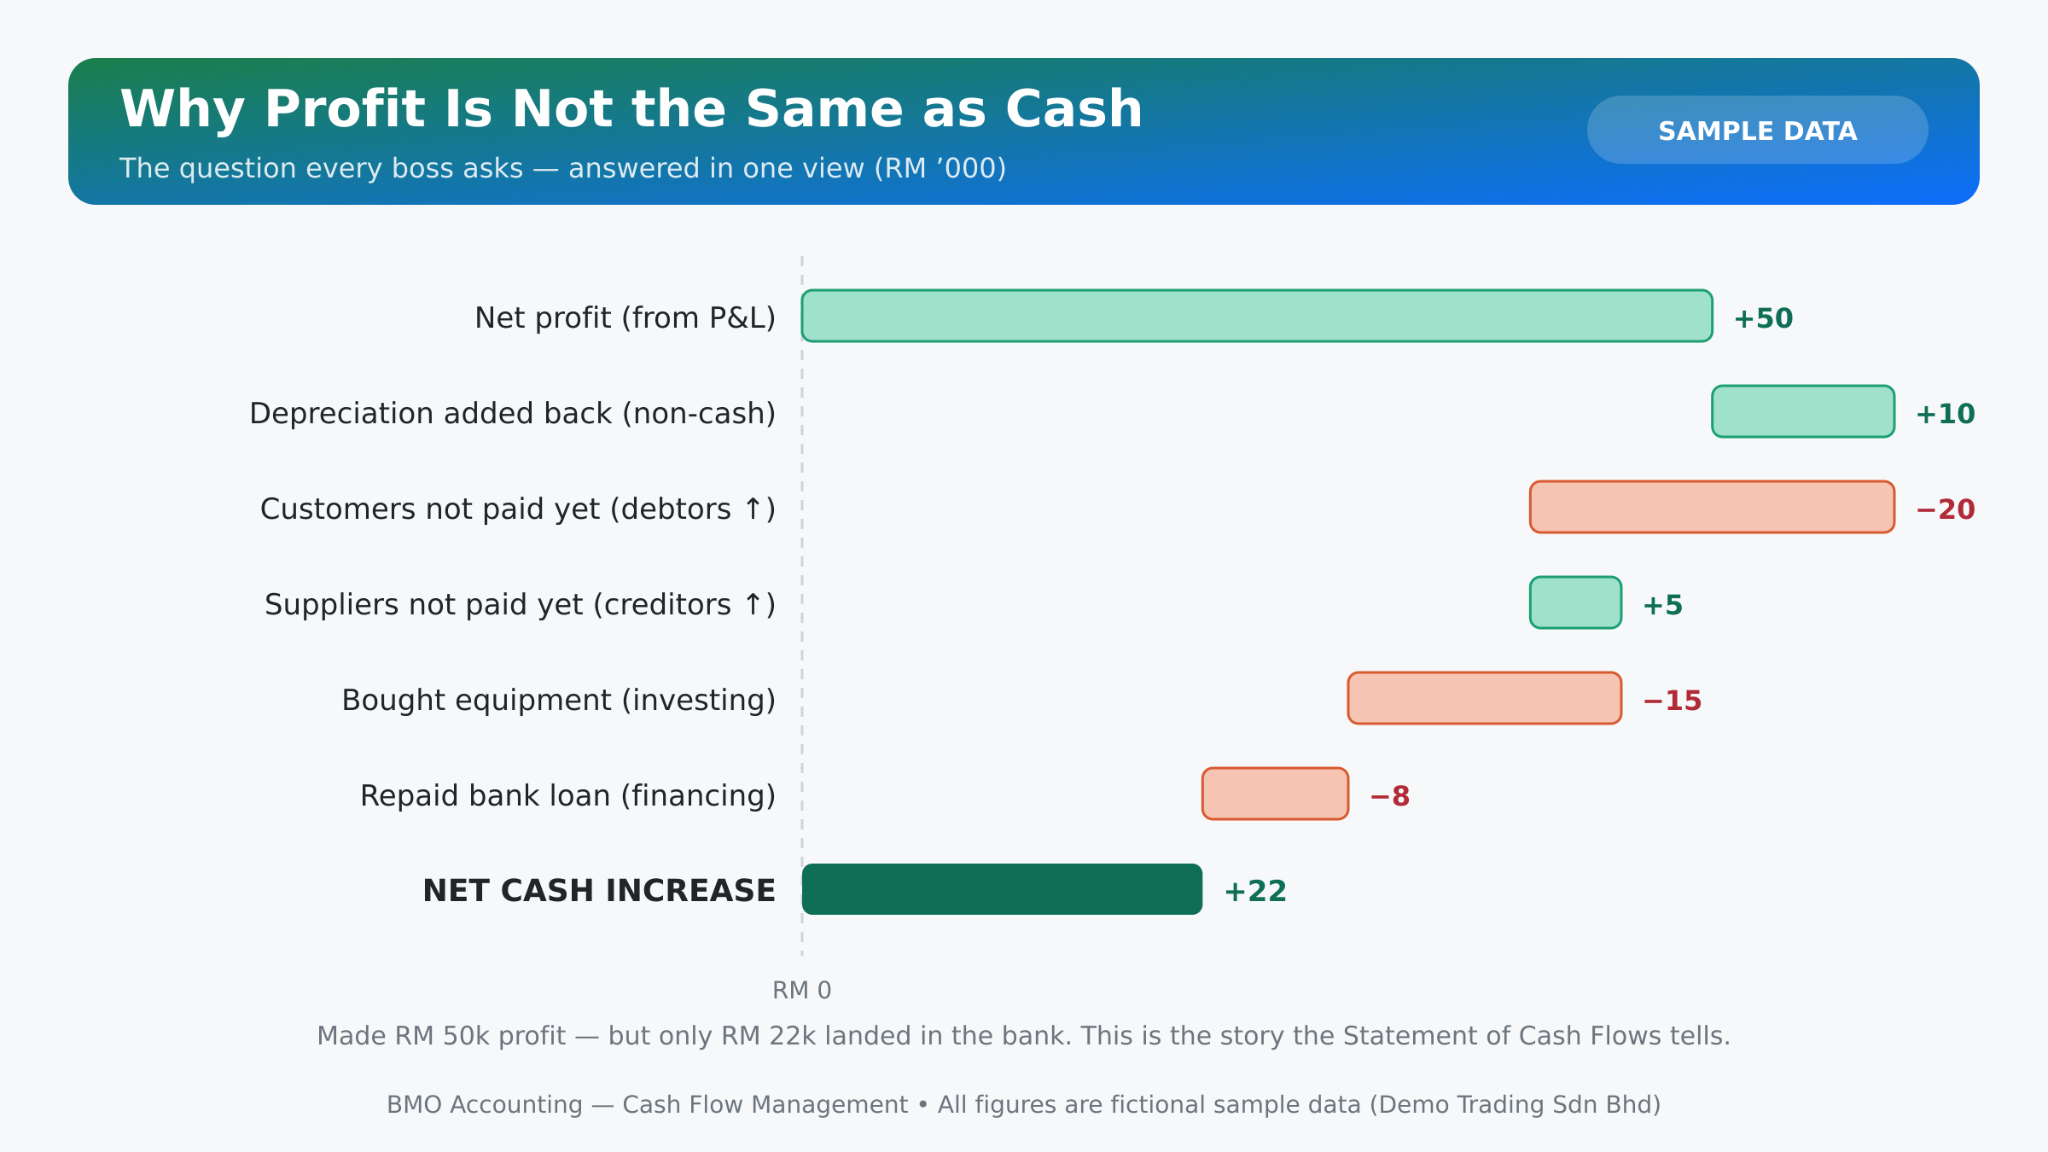
Why profit is not the same as cash
The question every boss asks: “The P&L says we made money — so where is it?” BMO explains the difference between accounting profit and actual bank movement.
- Net profit starts the story, but not every profit item is cash.
- Depreciation is added back because it is non-cash.
- Customers not paid yet reduce actual cash collected.
- Supplier credit, equipment purchases and bank loan repayments change cash without matching profit.
- Management sees the net cash increase clearly, not only the profit figure.
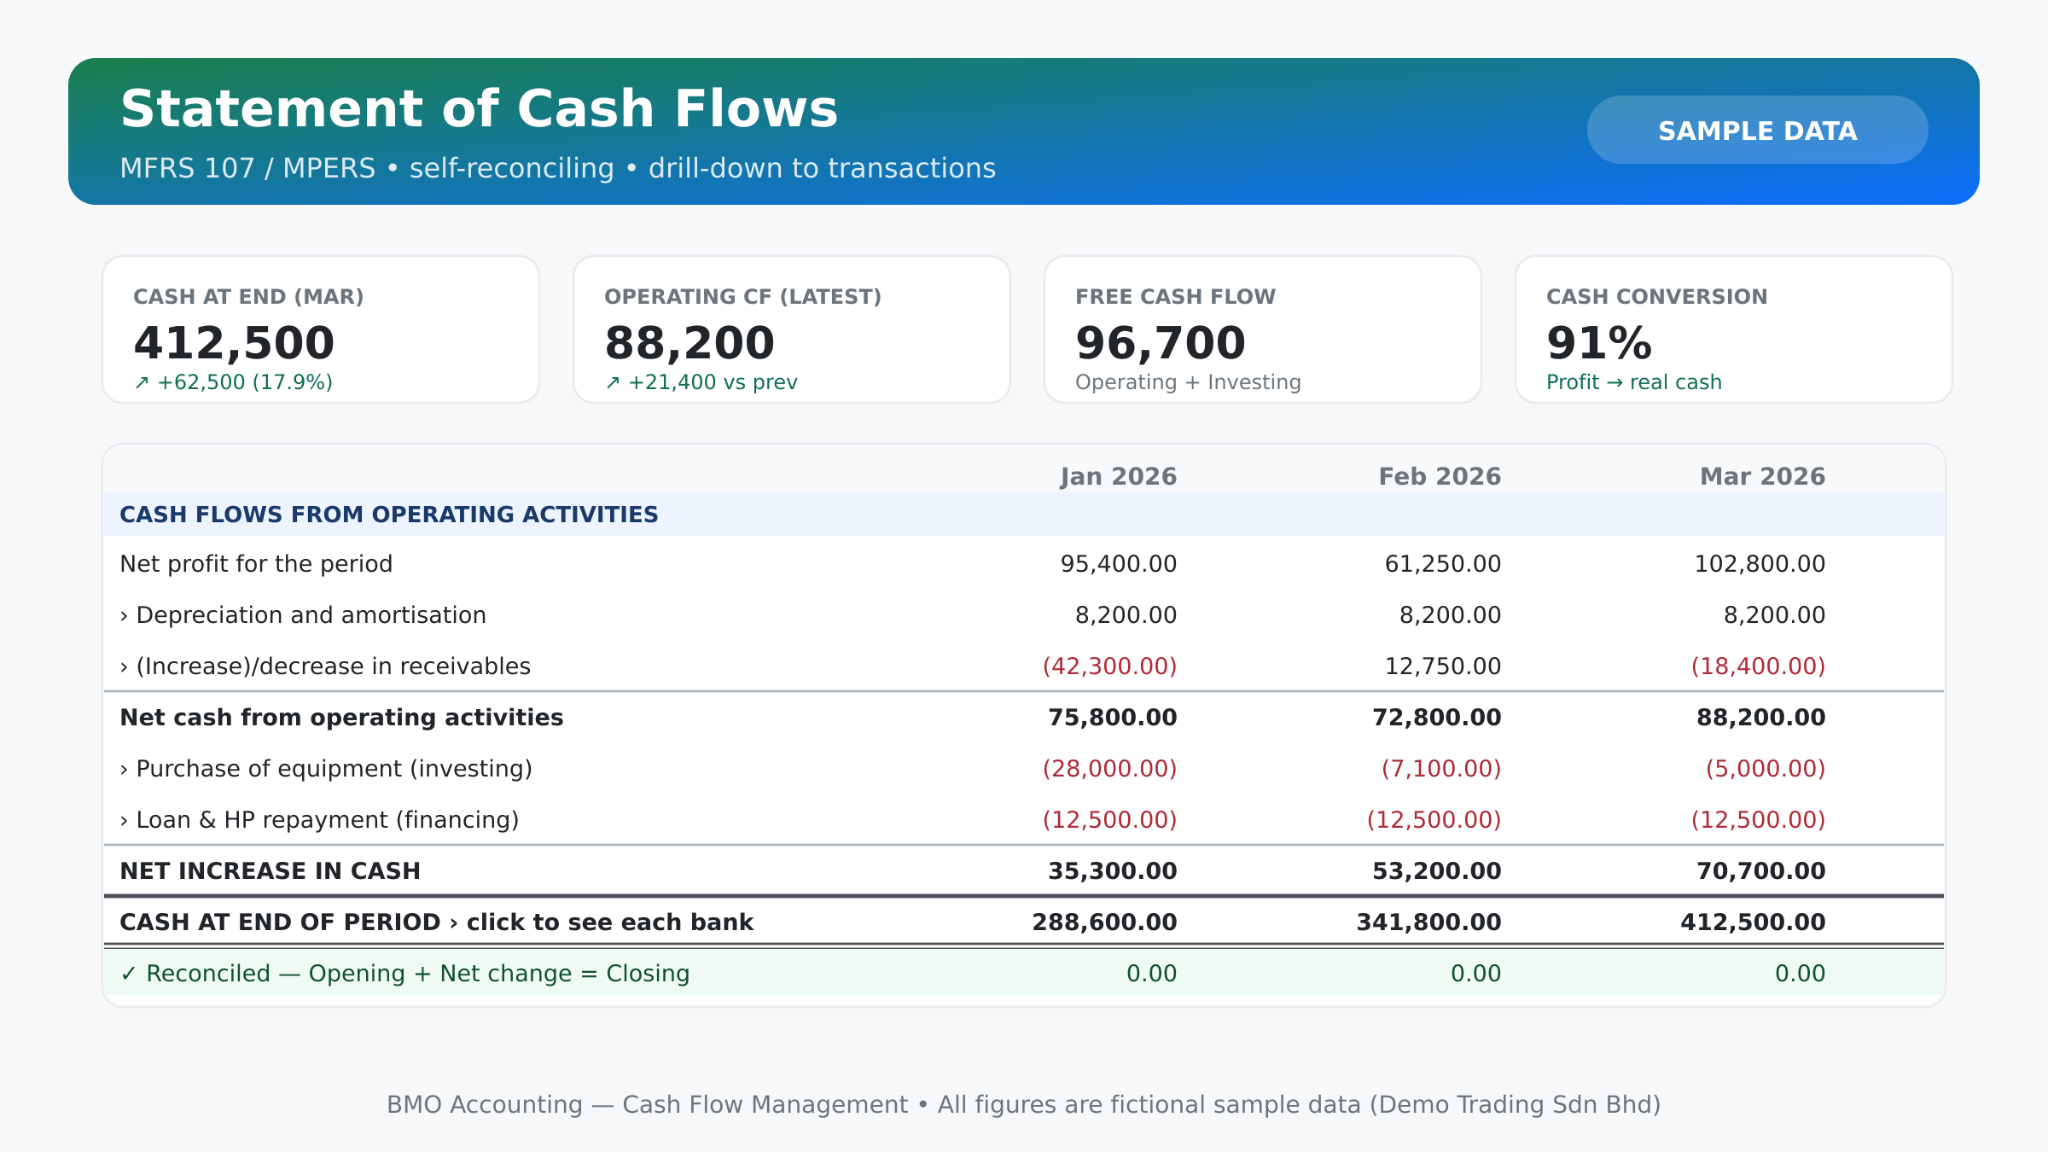
Statement of Cash Flows — the report your auditor and banker ask for
Starting from net profit, it shows exactly how much cash got tied up in unpaid invoices and stock, how much went into assets, and how much went to loan repayments — ending at the exact amount sitting in your bank.
Boss-ready reporting with drill-down
- Self-reconciling by design — the closing figure always equals your real bank balances, verified on every run. It cannot go out of balance.
- Click any line to drill down — expand to the GL accounts behind each number, then to the actual transactions.
- Boss-ready KPI & charts — one toggle shows Free Cash Flow, Cash Conversion %, activity bars and the balance trend.
- Quick periods — Today, This Month, This Quarter, This Half Year, This Year (fiscal) — or compare up to 12 months side by side.
| Jan 2026 | Feb 2026 | Mar 2026 | |
|---|---|---|---|
| CASH FLOWS FROM OPERATING ACTIVITIES | |||
| Net profit for the period | 95,400.00 | 61,250.00 | 102,800.00 |
| ›Depreciation and amortisation | 8,200.00 | 8,200.00 | 8,200.00 |
| ›(Increase)/decrease in trade receivables | (42,300.00) | 12,750.00 | (18,400.00) |
| ›Increase/(decrease) in trade payables | 14,500.00 | (9,400.00) | (4,400.00) |
| Net cash from operating activities | 75,800.00 | 72,800.00 | 88,200.00 |
| CASH FLOWS FROM INVESTING ACTIVITIES | |||
| ›Purchase of property, plant and equipment | (28,000.00) | (7,100.00) | (5,000.00) |
| CASH FLOWS FROM FINANCING ACTIVITIES | |||
| ›Repayment of borrowings & hire purchase | (12,500.00) | (12,500.00) | (12,500.00) |
| NET INCREASE / (DECREASE) IN CASH | 35,300.00 | 53,200.00 | 70,700.00 |
| ›Cash at beginning of period (click to see each bank) | 253,300.00 | 288,600.00 | 341,800.00 |
| CASH AND CASH EQUIVALENTS AT END OF PERIOD | 288,600.00 | 341,800.00 | 412,500.00 |
| ✓ Reconciled — Opening + Net change = Closing | 0.00 | 0.00 | 0.00 |
Cash Flow Forecast — see a cash shortage weeks before it happens
The statement looks backward; the forecast looks forward. It lines up every unpaid customer invoice and supplier bill by due date, adds your recurring commitments, and projects your bank balance week by week — so you can act before the tight spot, not after.
- 13 / 26-week or 6 / 12-month horizon with overdue items front-loaded into Week 1 — chase those first.
- Recurring commitments manager built in — enter payroll, EPF/SOCSO/PCB, rent, CP204 instalments and loan payments once.
- Shortfall alert — the lowest projected balance is flagged, with the exact week it happens.
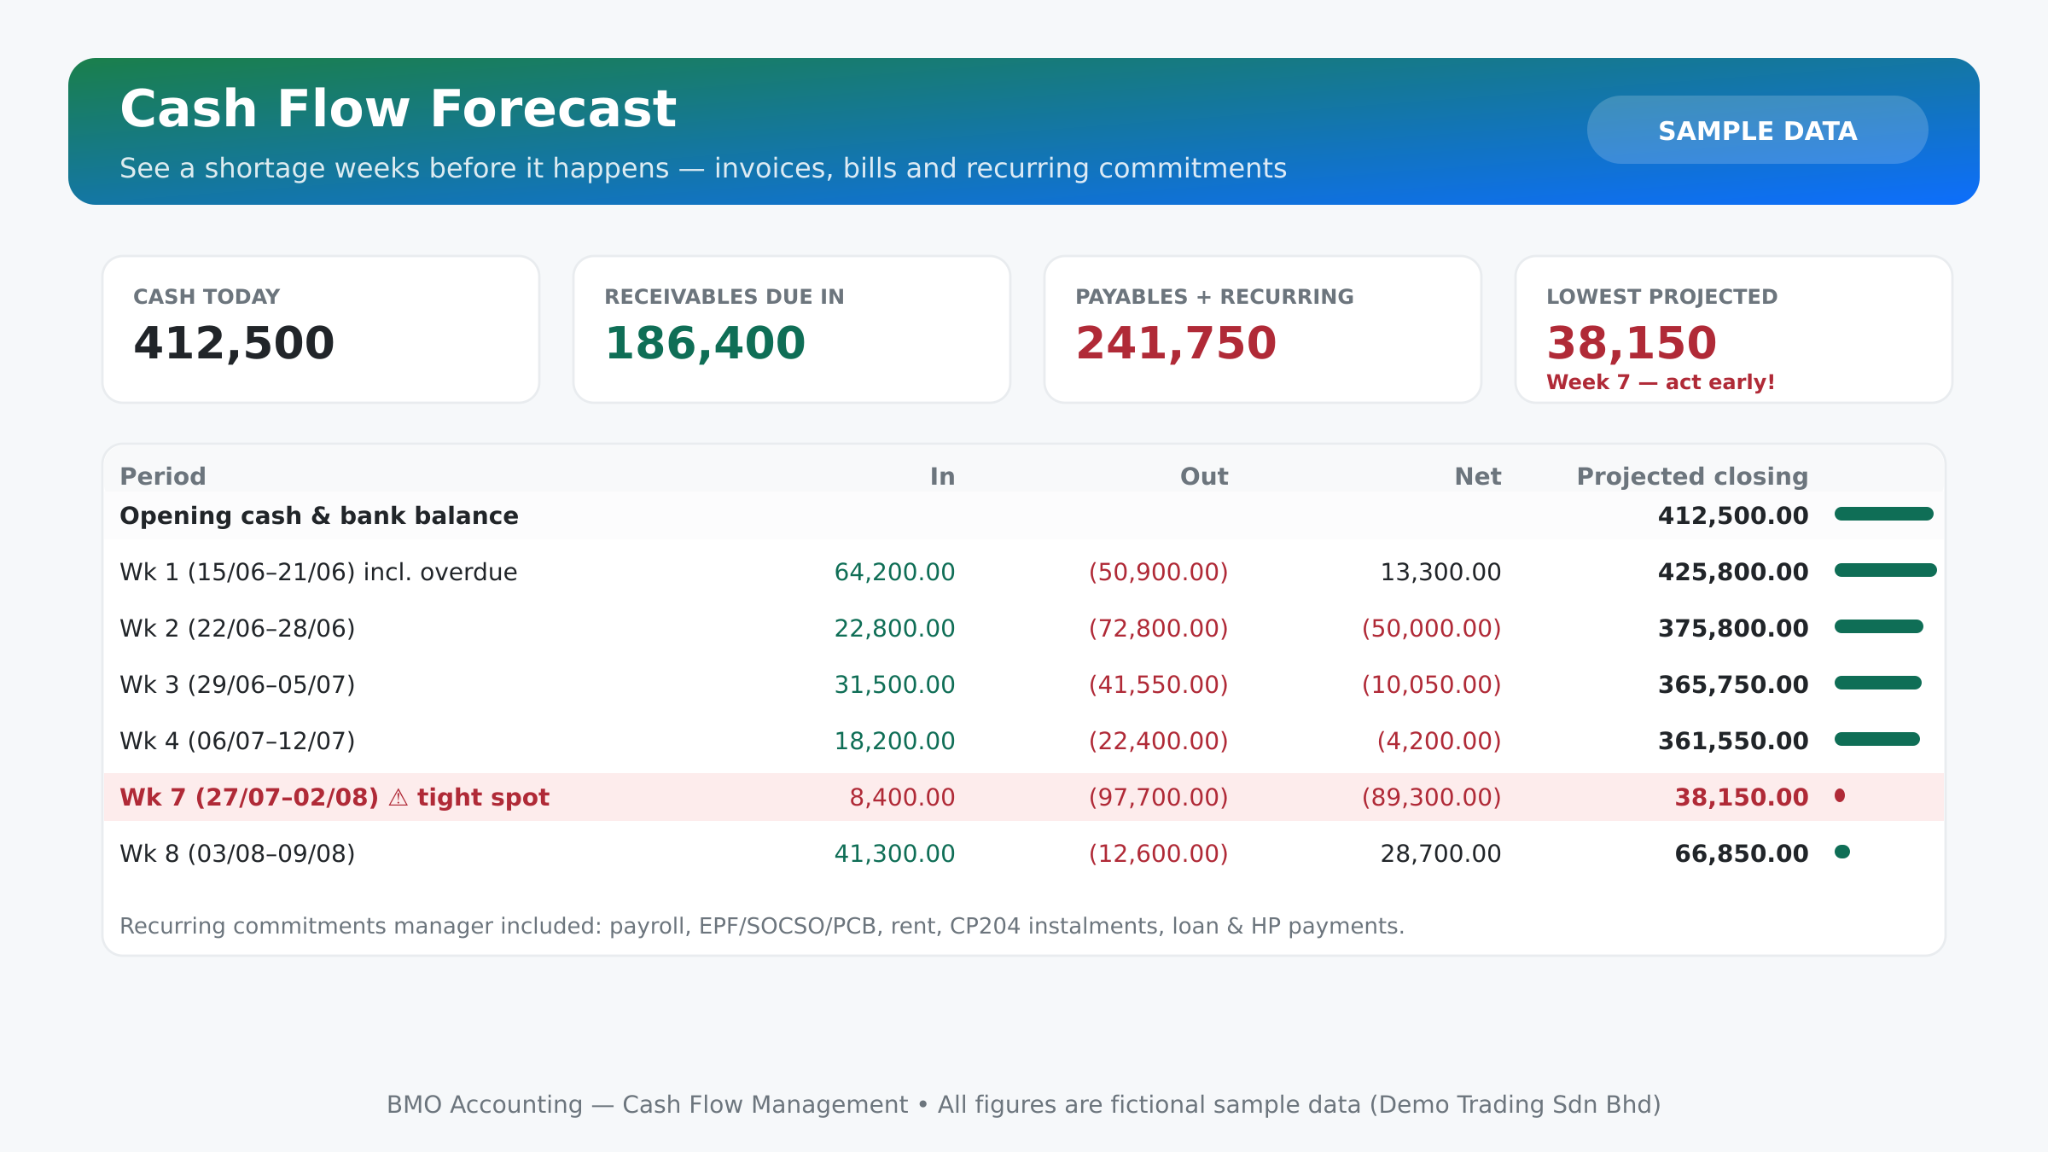
| Period | Invoices due (in) | Recurring (in) | Bills due (out) | Recurring (out) | Net | Projected closing | |
|---|---|---|---|---|---|---|---|
| Opening cash & bank balance | 412,500.00 | ||||||
| Wk 1 (15/06–21/06) incl. overdue | 64,200.00 | 0.00 | (48,900.00) | (2,000.00) | 13,300.00 | 425,800.00 | |
| Wk 2 (22/06–28/06) | 22,800.00 | 0.00 | (18,300.00) | (54,500.00) | (50,000.00) | 375,800.00 | |
| Wk 3 (29/06–05/07) | 31,500.00 | 0.00 | (26,750.00) | (14,800.00) | (10,050.00) | 365,750.00 | |
| Wk 7 (27/07–02/08) ⚠ tight spot | 8,400.00 | 0.00 | (41,200.00) | (56,500.00) | (89,300.00) | 38,150.00 | |
| … 9 more weeks shown in the full report, with recurring commitments manager below the table. | |||||||
Bank / Cash Book
Every receipt and payment per bank account with a live running balance, daily KPI charts and the reconciliation tick from Bank Reconciliation — the 5-minute daily check for your finance staff.
| Date | Ref | Receipt | Payment | Balance | ✓ |
|---|---|---|---|---|---|
| Opening balance b/f | 120,400.00 | ||||
| 01/06 | OR-0001 | 12,500.00 | 132,900.00 | ● | |
| 02/06 | PV-0001 | 8,300.00 | 124,600.00 | ● | |
| 03/06 | OR-0002 | 34,250.00 | 158,850.00 | ○ | |
| Closing c/f | 86,250.00 | 47,750.00 | 158,900.00 | ||
Cash Flow Mapping with Auto-Map
Tag each balance sheet account with its cash flow category once. Auto-Map handles even charts with 7,000+ customer and supplier accounts in one click — you only verify the bank list. Unmapped accounts can never hide a difference: they show openly on one line.
| GL Code | Account | Category |
|---|---|---|
| 390-1000 | Bank Account A | CASH |
| 300-0000 | Customer A Sdn Bhd | RECEIVABLES |
| 310-0000 | Stock | INVENTORY |
| 460-0000 | Term Loan — Bank B | FINANCING |
| 200-0000 | Office Equipment | INVESTING |
Built to explain cash clearly
From statement reporting to forecast planning, BMO gives finance teams and business owners one place to check cash movement.
Cash Flow Management questions
These answers are written for both website visitors and answer engines.
What is BMO Cash Flow Management?
BMO Cash Flow Management is a module in BMO Accounting that shows where company cash went and where it is going next. It includes Statement of Cash Flows, Cash Flow Forecast, Bank/Cash Book and one-time cash flow account mapping.
Why is profit not the same as cash?
Profit can be different from cash because sales may not be collected yet, stock may hold company money, bills may not be paid yet, and cash may be used for equipment, loan instalments or other financing activities.
How does the Statement of Cash Flows work in BMO Accounting?
BMO Accounting uses accounting transactions posted to the general ledger. Each relevant account is mapped once to Operating, Investing, Financing or Cash & Bank. The system then builds the Statement of Cash Flows for the selected period and checks that closing cash agrees with bank balances.
Does the cash flow statement reconcile to the bank?
Yes. The closing figure is designed to agree with the cash and bank balances. The report shows the reconciliation result so management can check Opening Cash plus Net Change equals Closing Cash.
Can I forecast future cash shortages?
Yes. The Cash Flow Forecast projects future cash based on unpaid customer invoices, supplier bills and recurring commitments such as payroll, EPF, SOCSO, PCB, rent, CP204 instalments, loan and hire purchase payments.
What forecast periods are supported?
The forecast can be prepared using short-term horizons such as 13 weeks or 26 weeks, and longer views such as 6 months or 12 months, depending on business planning needs.
What is Cash Flow Mapping?
Cash Flow Mapping is a one-time setup where each balance sheet account is tagged to the correct cash flow category, such as receivables, inventory, investing, financing or cash. This lets the system generate cash flow reports from accounting data.
Can BMO auto-map many accounts?
Yes. Auto-Map can classify large charts of accounts, including thousands of customer and supplier accounts, and highlight anything unmapped so finance users can verify the setup.
Can users drill down into the cash flow report?
Yes. Users can drill from a cash flow line to the related general ledger accounts and then to the individual transactions behind the amount.
Can reports be exported?
Yes. Cash flow reports can be exported to CSV for spreadsheet checking and PDF for management reporting or presentation.
Is this suitable for Malaysian SMEs?
Yes. The page content is written for Malaysian SMEs and includes local cash planning items such as EPF, SOCSO, PCB, CP204 instalments, SST handling and MFRS 107 / MPERS style reporting.
Does this replace accounting review?
No. The module helps prepare cash flow information from accounting data, but companies should still review their accounts, bank reconciliation, tax treatment and financial reporting with their accountant or auditor where needed.
Stop guessing your cash position.
Cash Flow Management is available in BMO Accounting. Let your management team see where cash went, why profit is different from cash, and when the next tight week may happen.
Try It Free / Request DemoAll screens above use fictional sample data (“Demo Trading Sdn Bhd”). Please review accounting, tax and reporting treatment with your accountant or auditor where required.